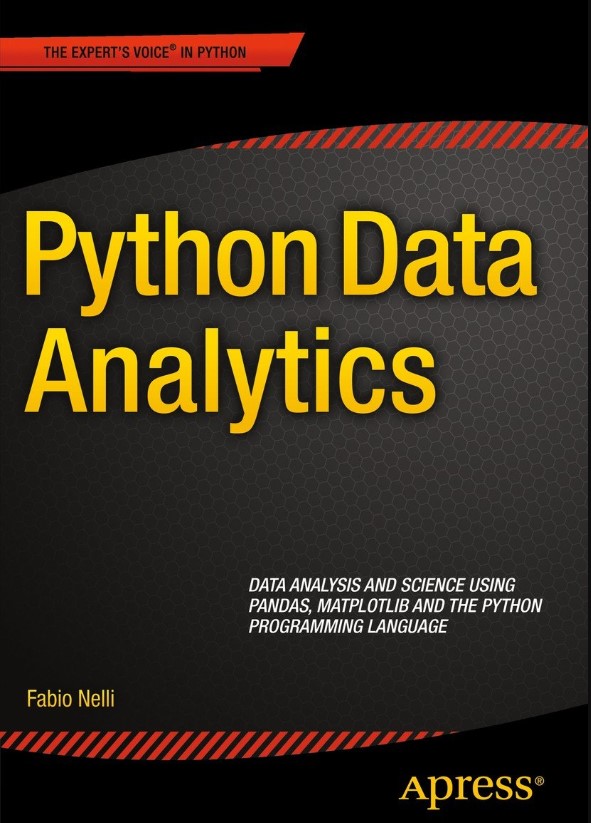
Python Data Analytics: Data Analysis and Science Using Pandas, matplotlib, and the Python Programming Language
Python Data Analytics will help you tackle the world of data acquisition and analysis using the power of the Python language. At the heart of this book lies the coverage of pandas, an open source, BSD-licensed library providing high-performance, easy-to-use data structures and data analysis tools for the Python programming language.
Author Fabio Nelli expertly shows the strength of the Python programming language when applied to processing, managing and retrieving information. Inside, you will see how intuitive and flexible it is to discover and communicate meaningful patterns of data using Python scripts, reporting systems, and data export. This book examines how to go about obtaining, processing, storing, managing and analyzing data using the Python programming language.
You will use Python and other open source tools to wrangle data and tease out interesting and important trends in that data that will allow you to predict future patterns. Whether you are dealing with sales data, investment data (stocks, bonds, etc.), medical data, web page usage, or any other type of data set, Python can be used to interpret, analyze, and glean information from a pile of numbers and statistics.
This book is an invaluable reference with its examples of storing and accessing data in a database; it walks you through the process of report generation; it provides three real world case studies or examples that you can take with you for your everyday analysis needs.
What you’ll learn
- How to set up your environment and use automation scripts
- Where and how to get your data
- How to analyze your data with Python's data analysis library, called pandas
- How to carry out visualization with matplotlib
- How to analyze text data using Python's natural language processing
Who this book is for
This book is for the mid to experienced level programmer who already knows the basics of Python programming. It is for programmers who want to know how to use database data and reporting tools to manipulate raw data into coherent useful information.
Table of Contents
1. Setup Your Environment
2. Automation Scripts
PART II
3. Where and How to Get Data
4. Introduction to pandas
5. pandas In-Depth
6. Python Data Visualizations with matplotlib
7. Designing Beautiful Graphs
8. Analyze Text Data with Natural Language Processing
9. Full Example project 1
10. Full Example project 2
11. Full Example project 3
Appendix A
Appendix B
- Paperback: 364 pages
- Publisher: Apress; 1 edition (August 21, 2015)
- Language: English
- ISBN-10: 1484209591
- ISBN-13: 978-1484209592
- Product Dimensions: 7 x 0.8 x 10 inches


